
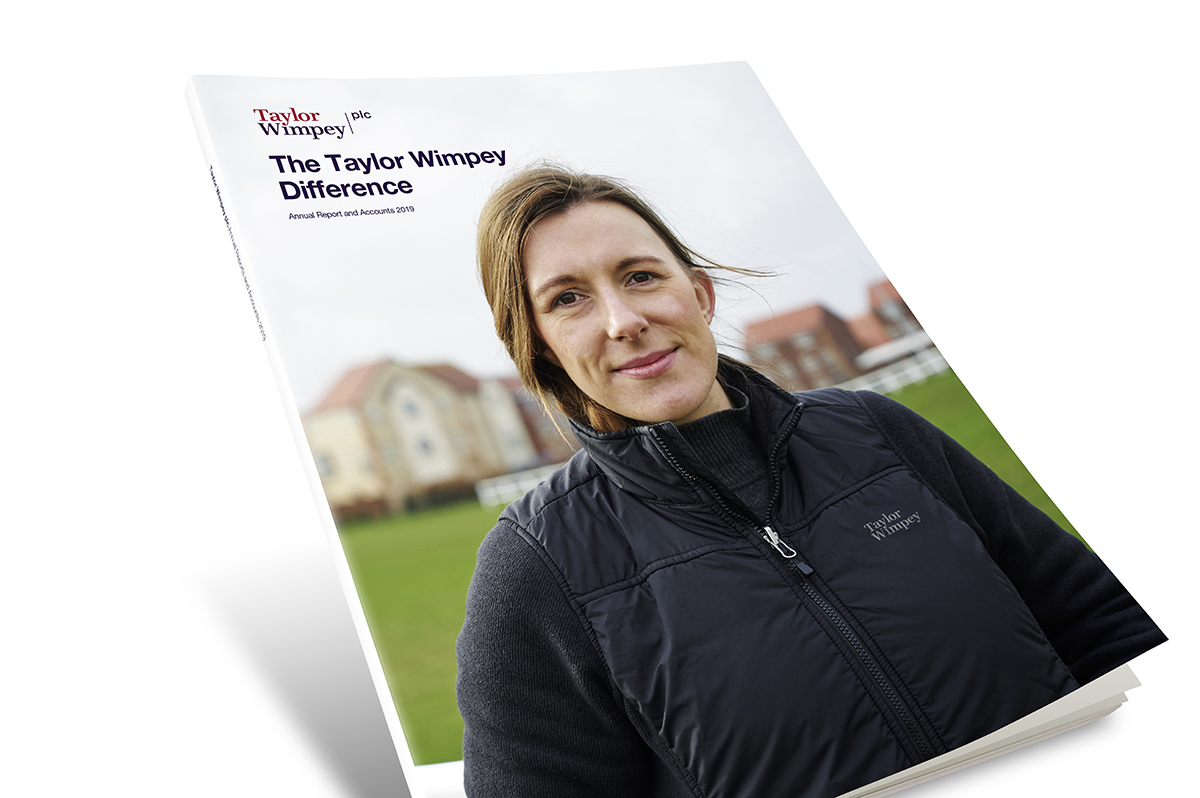
2019 in review
This section contains our 2019 operating and financial highlights.
This section contains our 2019 operating and financial highlights.
2019 operating and financial highlights
We have a culture embedded throughout the business of ‘doing the right thing’. Our reputation is important to us and we will not compromise the character of the business. This is increasingly important in a politically sensitive industry and with increased scrutiny and customer expectations.
“We have diverse and hardworking people at Taylor Wimpey who are committed to doing the right thing by the business and our customers; it’s what I have enjoyed most about working here.”
Novraj Sidhu, Managing Director

Whilst short term performance is important, we run the business for the long term. This underpins our approach to the investments into build quality and in developing our people. We also need to be prepared to respond to changes in our regulatory environment and want to play our part in tackling climate change. In an industry with a well-known skills shortage we see a long term benefit in our apprentice and direct labour programmes.
“I was thrilled to receive a coveted NHBC Pride in the Job Regional Award in 2019. It’s testament to all the hard work that has been put in by everyone on site and I for one am very proud of what we have achieved in raising the standards and quality of the homes we build.”
Dean Chinsky, Project Manager
Our high-quality landbank remains a key competitive advantage and an important driver of value as it enables us to build and sell the right product, create the right community and deliver the right service to our customers. We have an excellent short term landbank and strategic land pipeline, as measured by scale, quality of location and embedded margin. This gives us flexibility and options. Together, with our strong and well capitalised balance sheet, this means we can be very resilient through the cycle.
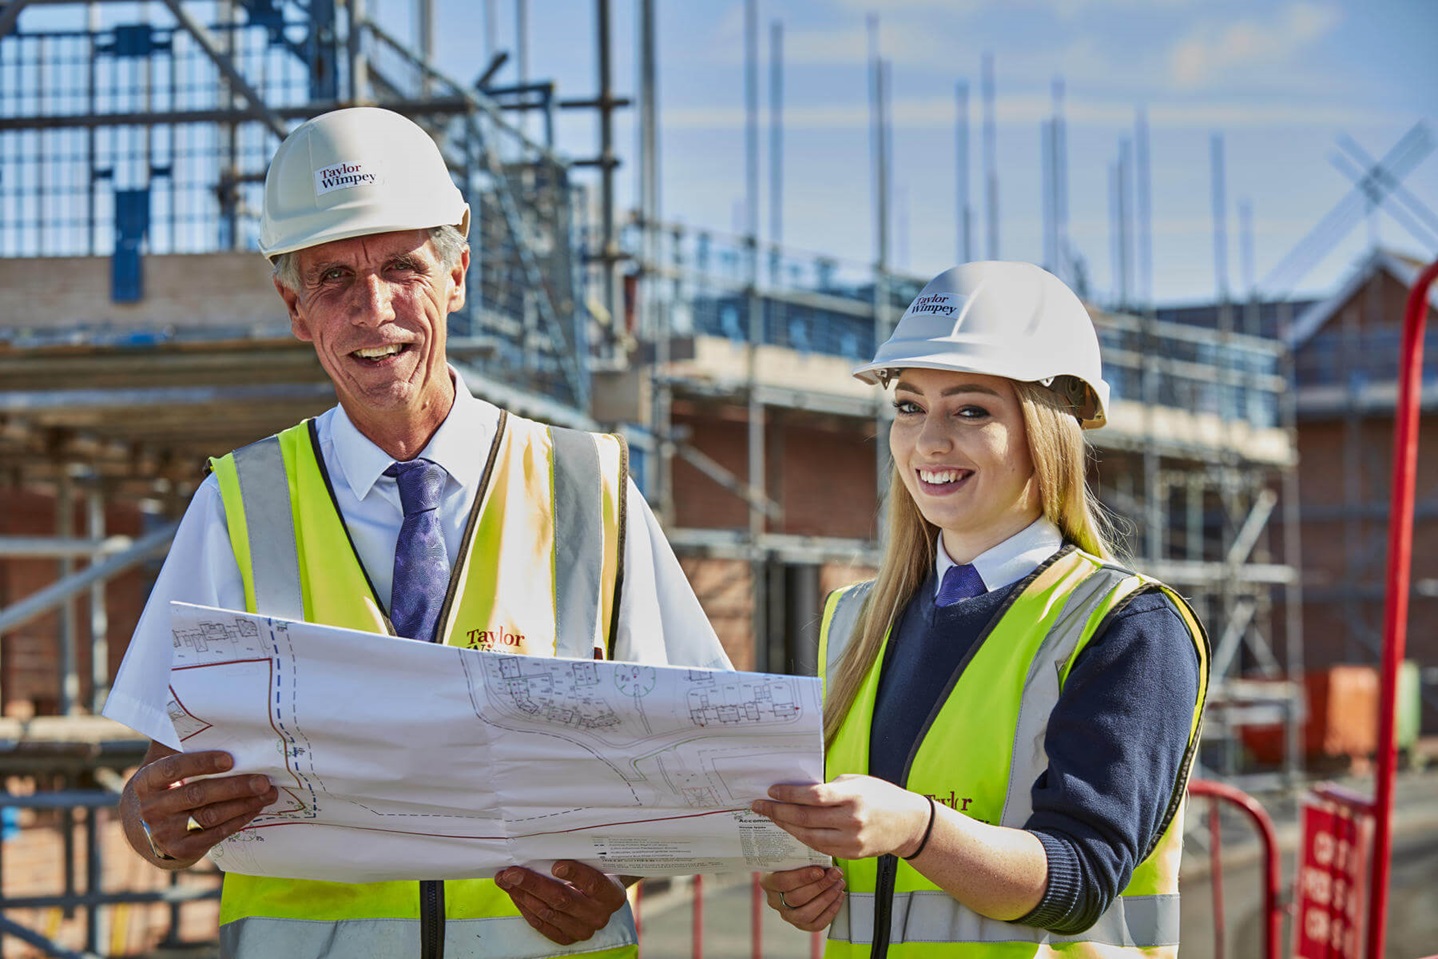
“One of the best parts of my job is completing and opening new infrastructure on a development, such as play areas and shops, which I know will make a huge difference to the local residents and help bring the place to life.”
Rebecca Bowker, Project Manager

We have the ability to grow, without compromising on quality or adding meaningful market risk at the right time in the cycle. Our factory approach to build can drive faster and more controlled growth which can be scaled up to deliver increases in volumes and cashflow on existing assets, depending on market conditions. Our differentiated approach to apprentices and direct labour provides us with a different kind of workforce that is flexible, high quality and part of the Taylor Wimpey culture, offering a route to high-quality growth.
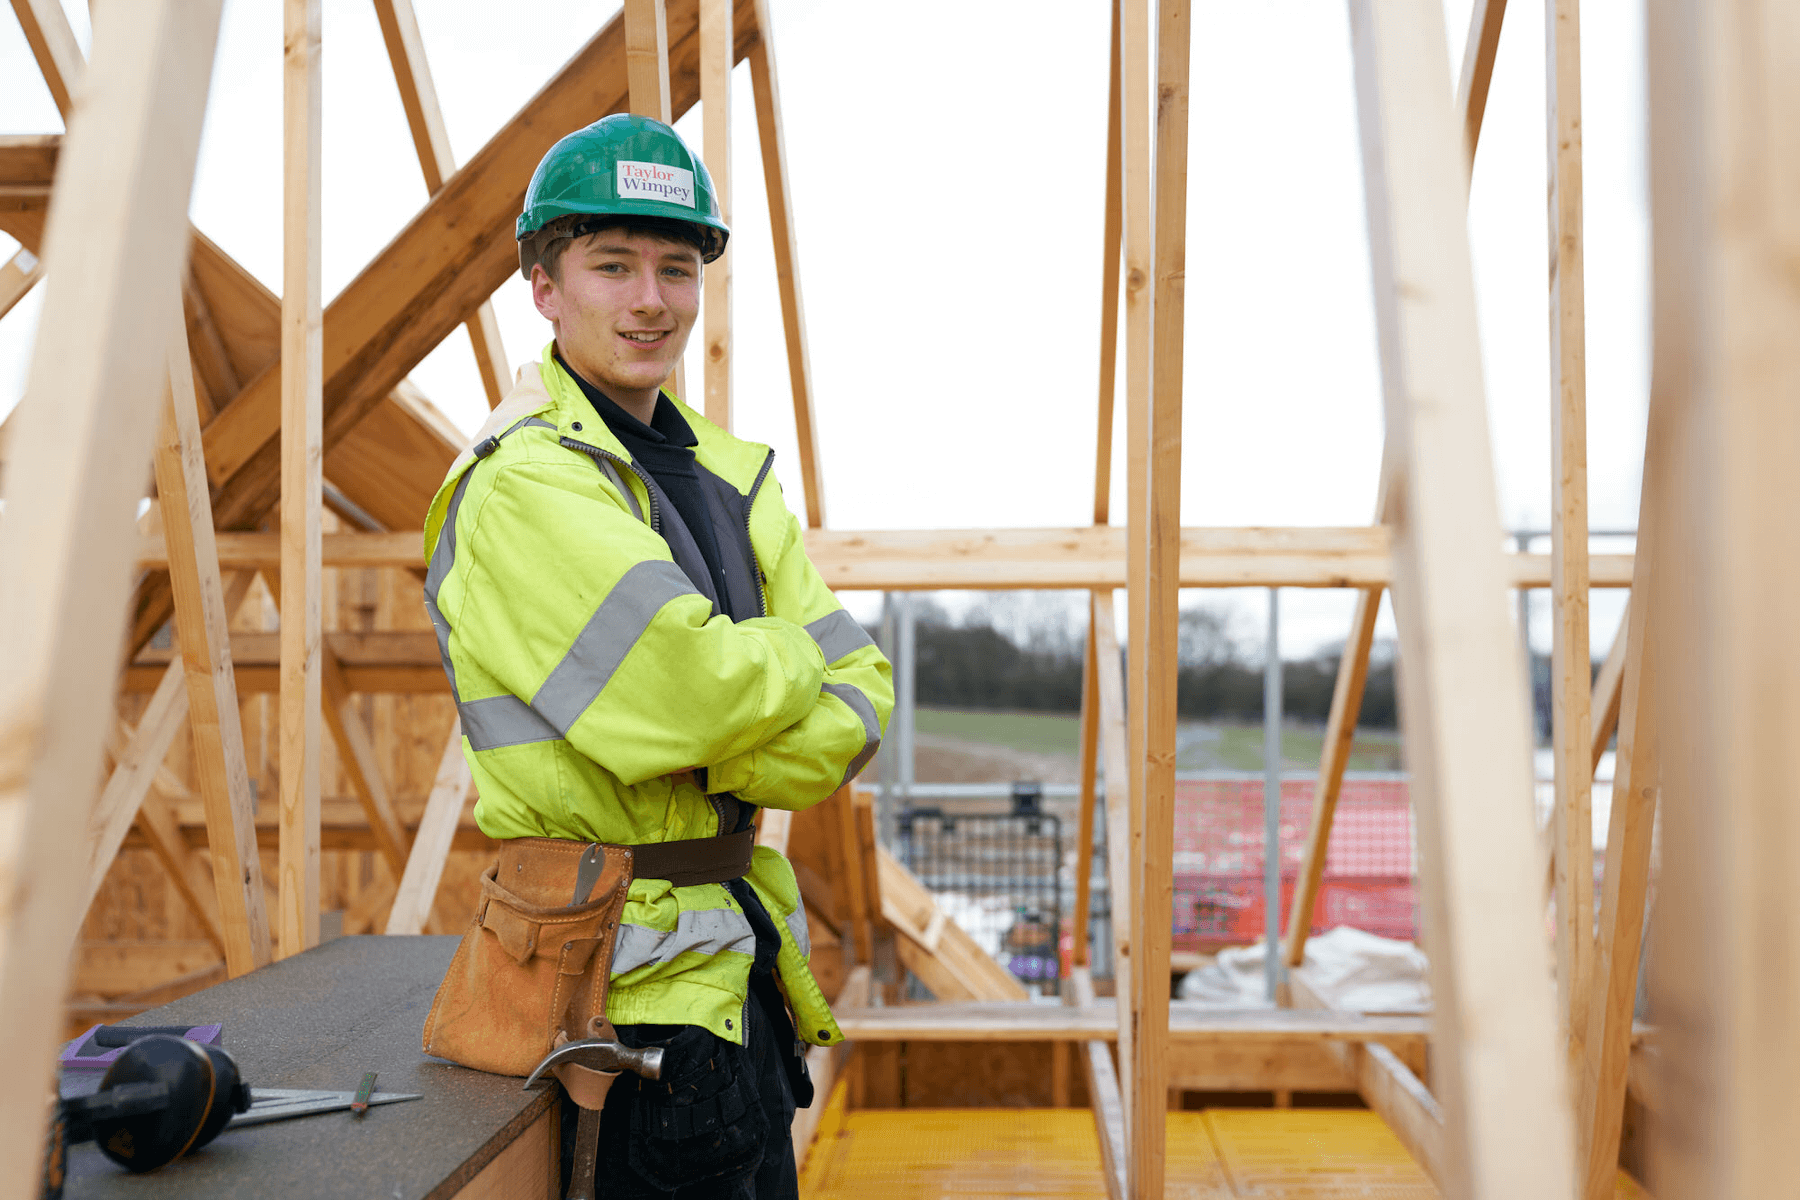
“We have our own dedicated apprentice area on site which has been great as we learn new skills. I have also become a qualified first-aider since starting with Taylor Wimpey. Eventually I would like to work my way up to become a Site Manager.”
Louis Mist, Carpentry Apprentice
We are a cash generative business and believe we can sustain this in times of market weakness, due to the strength of our balance sheet, the quality and length of our landbank and consequently the control we have over the timing of land investment. Our aim is to provide a reliable income stream to our shareholders.
“Being the first person a customer meets on their homebuying journey is a real privilege. My first home was a Taylor Wimpey home and we just recently moved up into our second! It’s given me a great insight into how and why customer experience matters so much, as a customer, employee and as a shareholder.”
Melissa Preston, Sales Executive

Despite wider macro-economic and political uncertainty, the UK new build housing market remained stable during 2019, albeit with more challenging conditions in London and the South East and at higher price points. Customer demand for new build homes continued to be robust, underpinned by low interest rates, a wide choice of mortgage products and the Government’s Help to Buy scheme. During the year we saw good levels of demand throughout the country, which converted into strong sales rates across the business.
In 2019, our teams achieved an industry-leading sales rate, delivering a 5% increase in home completions whilst at the same time improving quality, no mean feat. They have been busy implementing several initiatives over the past three years so, in 2020, our priority is embedding these improvements across the business. That said, one of our values is ‘better tomorrow’ so the Board has set a manageable number of new priorities for 2020. These are: increased focus on costs and process simplification, supporting our apprentice and direct labour programmes, outlining our environmental strategy and work on smoothing the completions profile to prevent bottlenecks and improve our customers’ experience. We will also work on specific medium term planning to deal with life post-Help to Buy and really test and challenge the cost base and specification of our new house type range, before we roll it out to our businesses and for our customers.
Jennie Daly - Group Operations Director
You will see employee quotes throughout this report taken from responses to our 2019 values campaign, and they show we are fortunate to have a motivated and engaged workforce. Our 2019 employee engagement survey was very positive, and Glassdoor identifies us as one of the UK’s top 50 places to work for a third successive year (as voted for by our employees). Retaining our talent is always a focus and we are committed to training and personal development plans to help everyone reach their potential and continue to advance initiatives to improve diversity and inclusivity (see our online Gender Pay Gap Report). Developing our pool of directly employed key trades is a key priority for 2020 to build in flexibility and establish a workforce with a customer focus and Taylor Wimpey values. As an industry leader in developing new trade apprentices, it is vital we have the supporting structures and teams of experienced colleagues in place to support them once they qualify.
Anne Billson-Ross - Group Human Resources Director
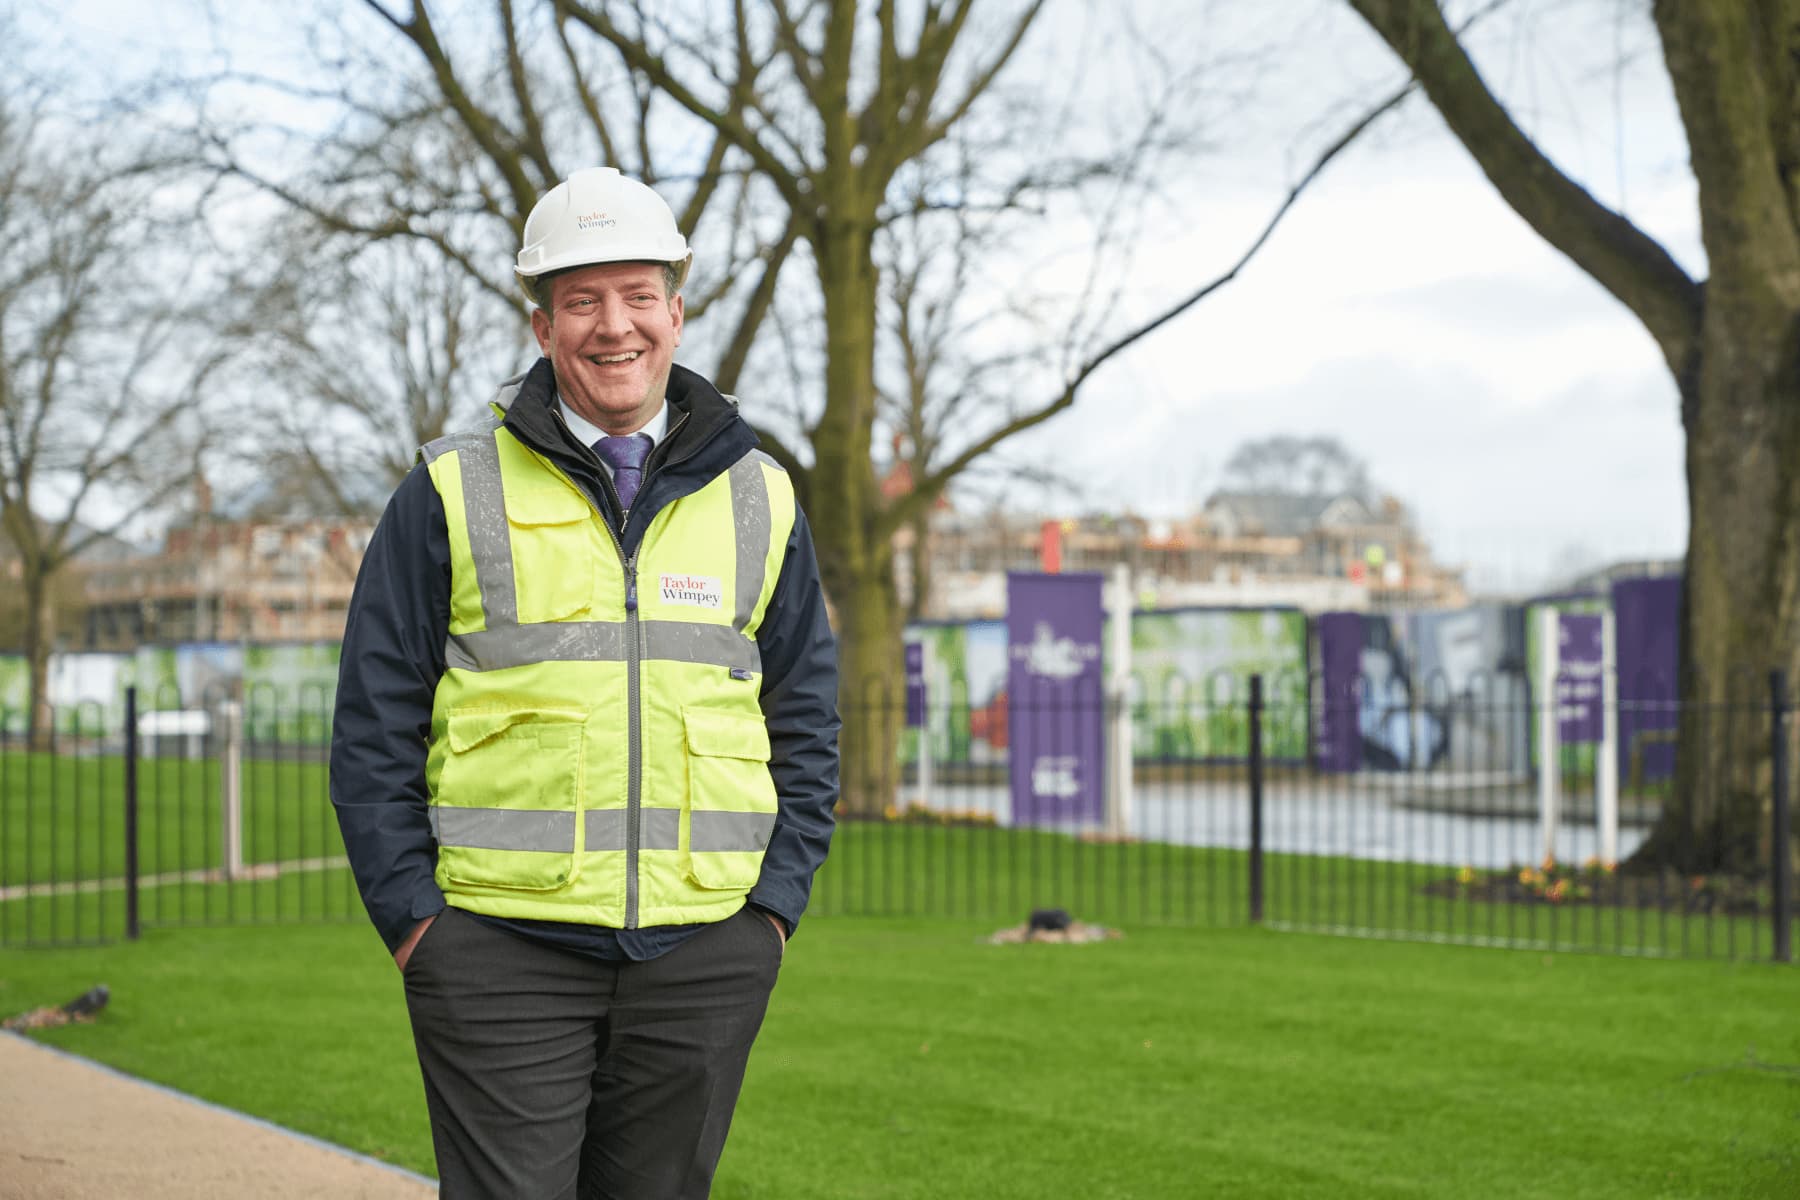
Under certain conditions in the cycle, strategic land can provide a margin advantage but the benefits of a large pipeline are broader. We have a record strategic pipeline of c.140k potential plots in areas we believe customers want to live. We have an excellent track record of converting these plots through the planning system, and for several years over half of our completions have been through strategic land. Therefore, the key benefits of our strategic pipeline are the advantage it gives us when planning our business and the significant competitive advantage of having exclusive opportunities to develop in locations where our customers want to live, close to local economies and amenities, supported by good transportation links. Strategically, good visibility of land coming through our pipeline enables us to plan great, sustainable places to live, maintaining strong buying discipline and so protecting our margin.
Daniel McGowan - Divisional Chair, North
We acknowledge the serious threat posed by climate change and biodiversity loss and the need for urgent action. The development of our environmental strategy and introduction of a science-based carbon reduction target by the end of 2020 is about formalising the good practices put in place throughout the business by our site teams and Sustainability Champions. We are pleased to have reduced our direct emissions intensity by 43% since 2013 and are on track for our targeted 50% reduction by 2023. We have also achieved an absolute reduction in emissions of 19% since 2013, even with a 42% increase in completed floor area. Taking action on the environment helps us to create better places to live for our customers and strengthens our relationships with employees and other stakeholders. It also reduces costs and risks to the business, with climate change and biodiversity identified as key risks and monitored by the Board.
Lee Bishop - Major Developments Director
Monitoring market conditions is a constant focus. As well as our live internal operating information, the GMT closely monitors market conditions across a range of metrics including market transactions, house pricing, materials pricing, affordability, planning permissions and land transactions. We are cautiously run with a strong balance sheet. We have built robustness and flexibility into our 24 regional businesses and are well positioned for all market conditions. Our Principal Risks (outlined on page 48) are closely monitored and discussed at Board and GMT meetings. This year we have refreshed our approach to explaining risks in a way which we hope is more helpful to our stakeholders.
Ingrid Osborne - Divisional Chair, London and South East
Our ‘strategy for larger sites’ should not be confused with us having a ‘large site strategy’ (prioritising larger sites over all others), we need a mix of site sizes for our planning and to better react to changing market circumstances. Large sites, where we generally operate from an earlier stage, offer us a great opportunity to shape and improve placemaking (design, facilities, biodiversity, landscaping) which is a key part of helping our customers develop new communities, a key focus for the Group. Sites such as Great Western Park (Didcot) and Somerdale (Keynsham) are excellent examples of what is possible in terms of creating attractive green spaces and excellent community facilities.
Nigel Holland - Divisional Chair, Central and South West
* Operating profit is defined as profit on ordinary activities before net finance costs, exceptional items and tax, after share of results of joint ventures.
** Return on net operating assets (RONOA) is defined as rolling 12-month operating profit divided by the average of the opening and closing net operating assets, which is defined as net assets less net cash, excluding net taxation balances and accrued dividends.
*** Operating cash flow is defined as cash generated by operations (which is before taxes paid, interest paid and payments related to exceptional charges).
† Tangible net assets per share is defined as net assets before any accrued dividends excluding goodwill and intangible assets divided by the number of ordinary shares in issue at the end of the period.
†† Adjusted basic earnings per share represents earnings attributed to the shareholders of the parent, excluding exceptional items and tax on exceptional items, divided by the weighted average number of shares in issue during the period.
†* Net operating asset turn is defined as 12-month rolling total revenue divided by the average of opening and closing net operating assets.
†** WIP turn is defined as total revenue divided by the average of opening and closing work in progress.
‡ Net cash / (debt) is defined as total cash less total financing.
‡‡ Cash conversion is defined as operating cash flow divided by operating profit on a rolling 12-month basis.
‡‡‡‡ Adjusted gearing is defined as adjusted net debt divided by net assets. Adjusted net debt is defined as net cash less land creditors.
Our strategy and key performance indicators
Making a difference for our stakeholders
Principal risks and uncertainties
Notice of meeting and shareholder services


